Sup. Material: Analysis of a Marseillevirus transcriptome reveals temporal gene expression profile and host transcriptional shift
Title: Analysis of a Marseillevirus transcriptome reveals temporal gene expression profile and host transcriptional shift
Running title: Transcriptomic analysis of Marseillevirus-host interaction
Authors: Rodrigo Araújo Lima Rodrigues1,2*; Amina Cherif Louazani2*; Agnello Picorelli3; Graziele Pereira Oliveira1,2; Francisco Pereira Lobo3; Philippe Colson2,4; Bernard La Scola2,4†; Jônatas Santos Abrahão1†
Affiliation:
1 Laboratório de Vírus, Departamento de Microbiologia, Instituto de Ciências Biológicas, Universidade Federal de Minas Gerais, Belo Horizonte, Minas Gerais, Brazil
2 Microbes, Evolution, Phylogeny and Infection (MEΦI),Aix-Marseille Université UM63, IRD 198, AP-HM, Marseille, France
3 Laboratório de Algoritmos em Biologia, Departamento de Genética, Ecologia e Evolução, Instituto de Ciências Biológicas, Universidade Federal de Minas Gerais, Belo Horizonte, Minas Gerais, Brazil
4Institut Hospitalo-Universitaire (IHU) - Méditerranée Infection, Marseille, France
*These authors corresponded equally to this work
†Corresponding authors
e-mail: bernard.la-scola@univ-amu.fr and jonatas.abrahao@gmail.com
Table S1: Marseillevirus genes for which a valid transcript could be assembled using the Trinity-PASA pipeline.
Table S2: Statistical analysis of promoter motifs combination in association to different temporal classes of genes.
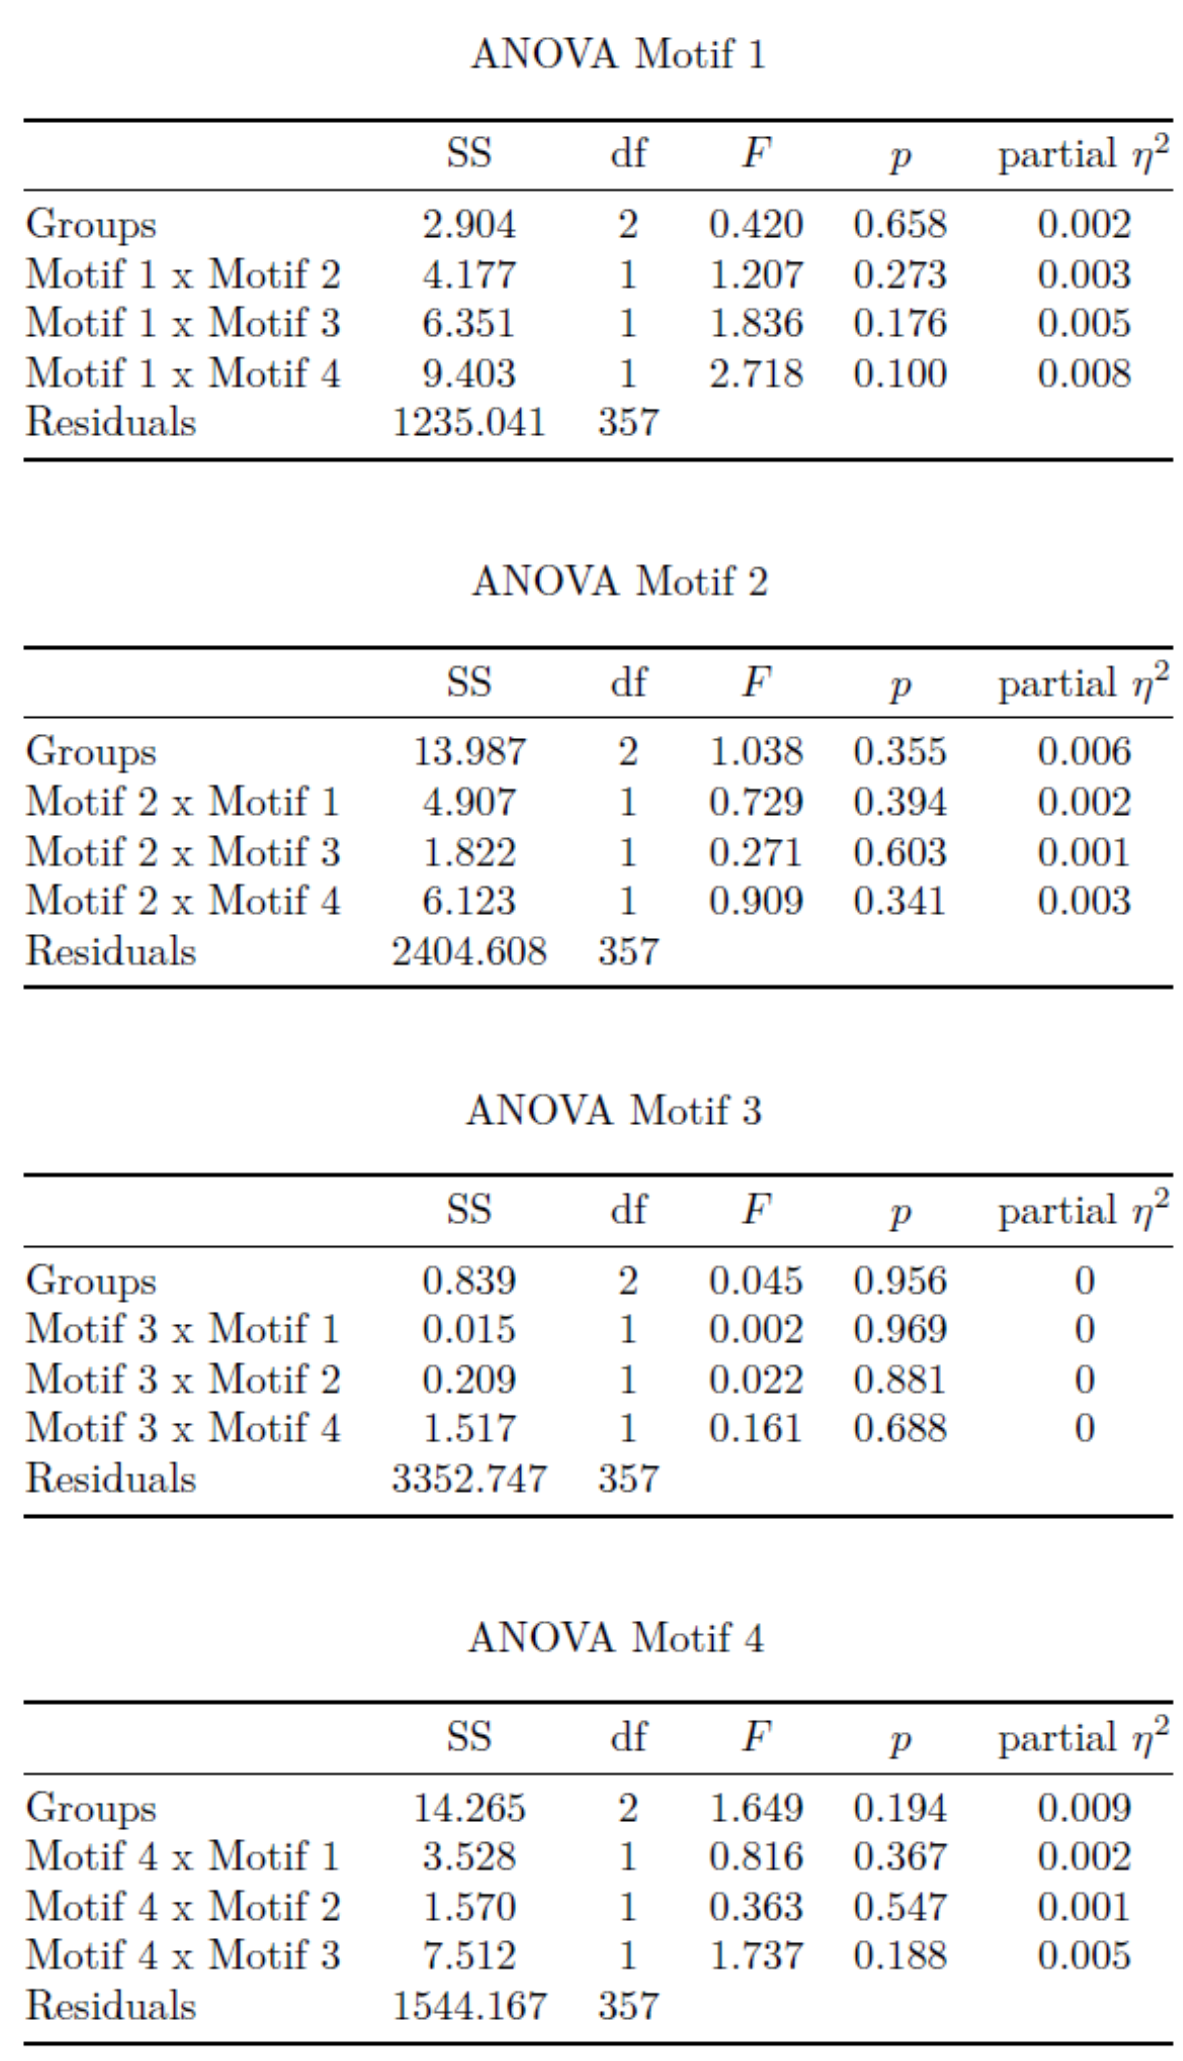
Table S3 Genes and primers used in RT-qPCR reactions.
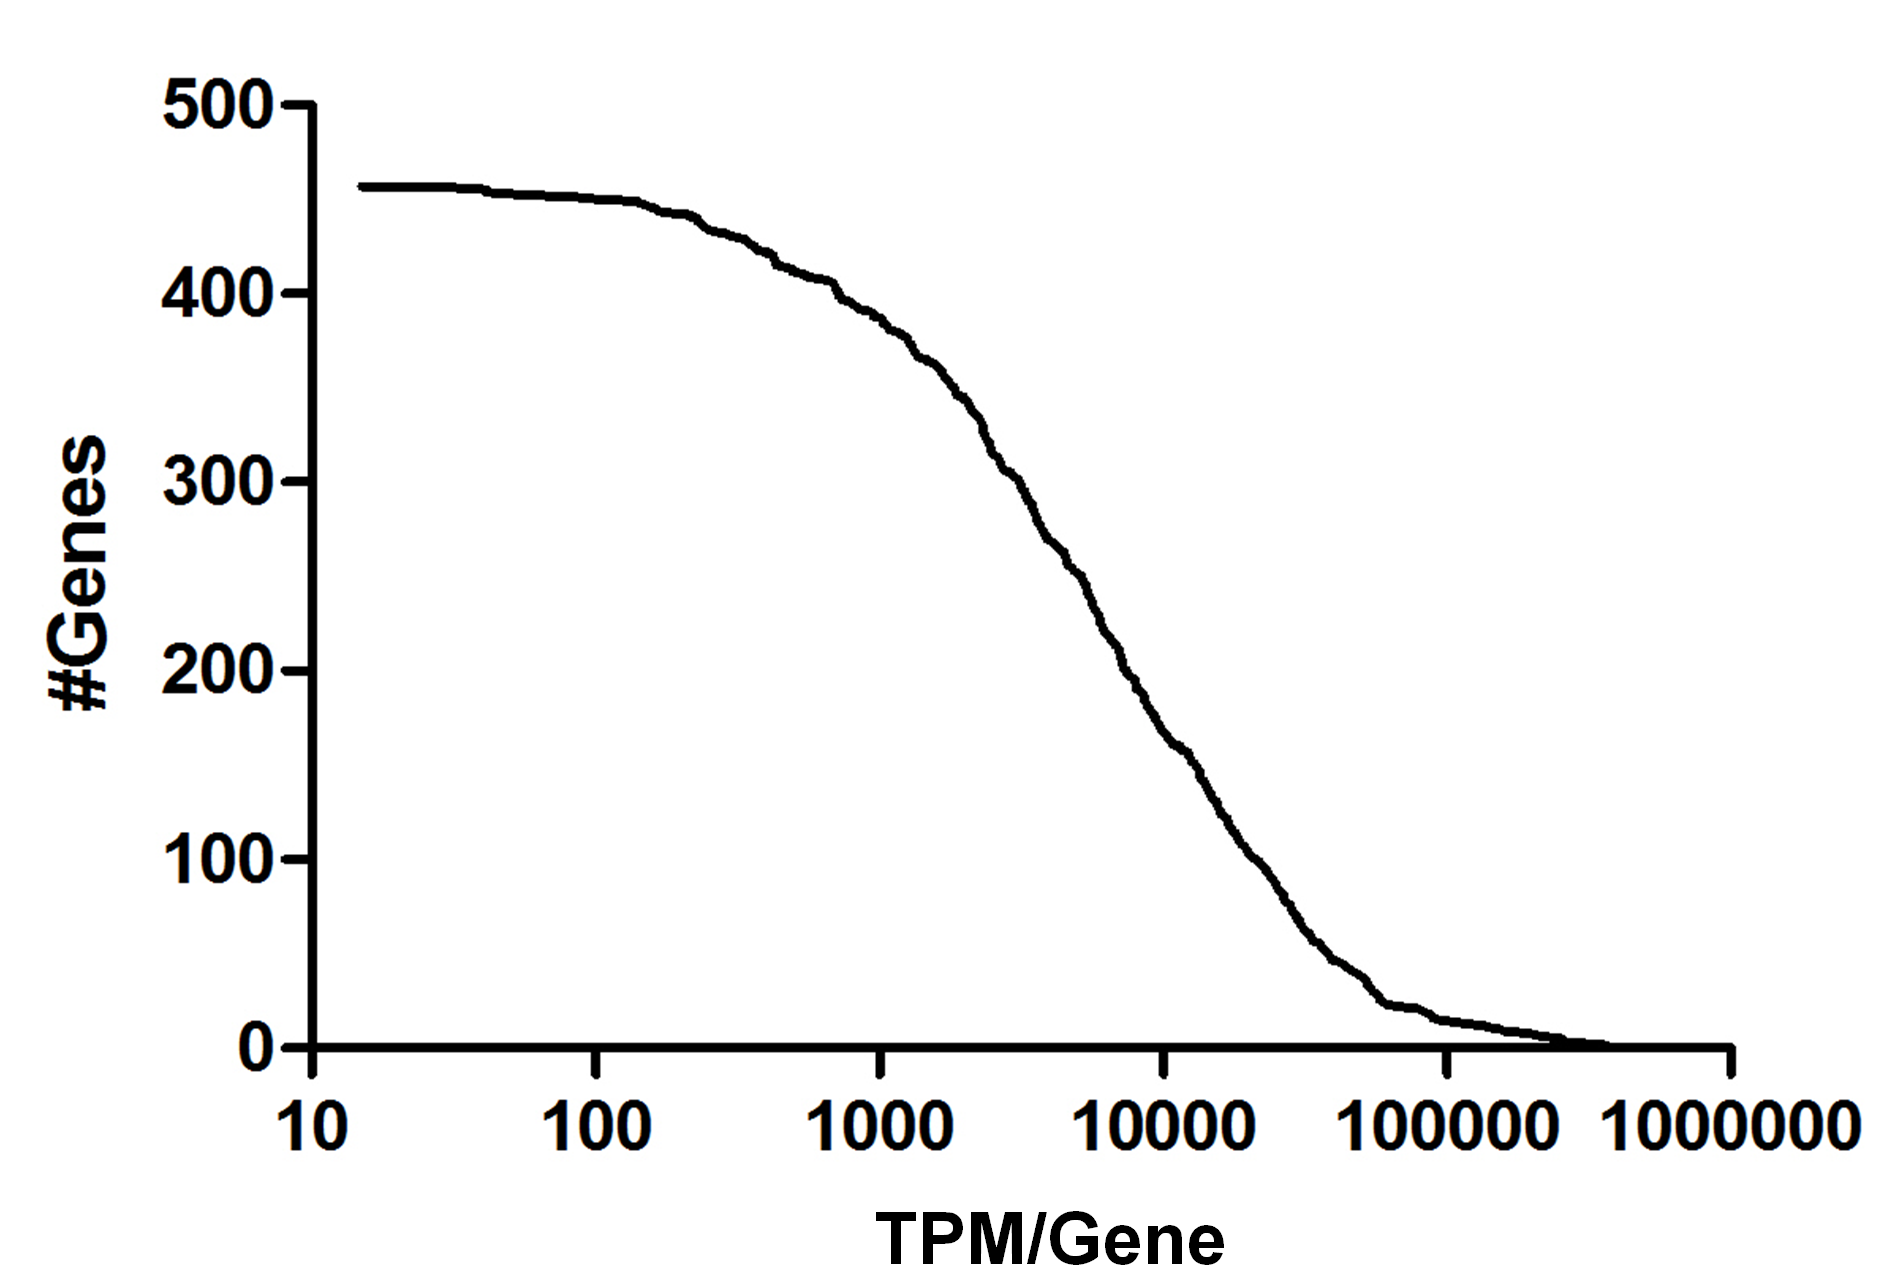
FIG S1: Number of genes vs number of total corresponding reads (cumulative). Cumulative distribution of total corresponding reads to the genes of Marseillevirus. Before normalization the number of reads per gene ranged from 15 to 372,331.
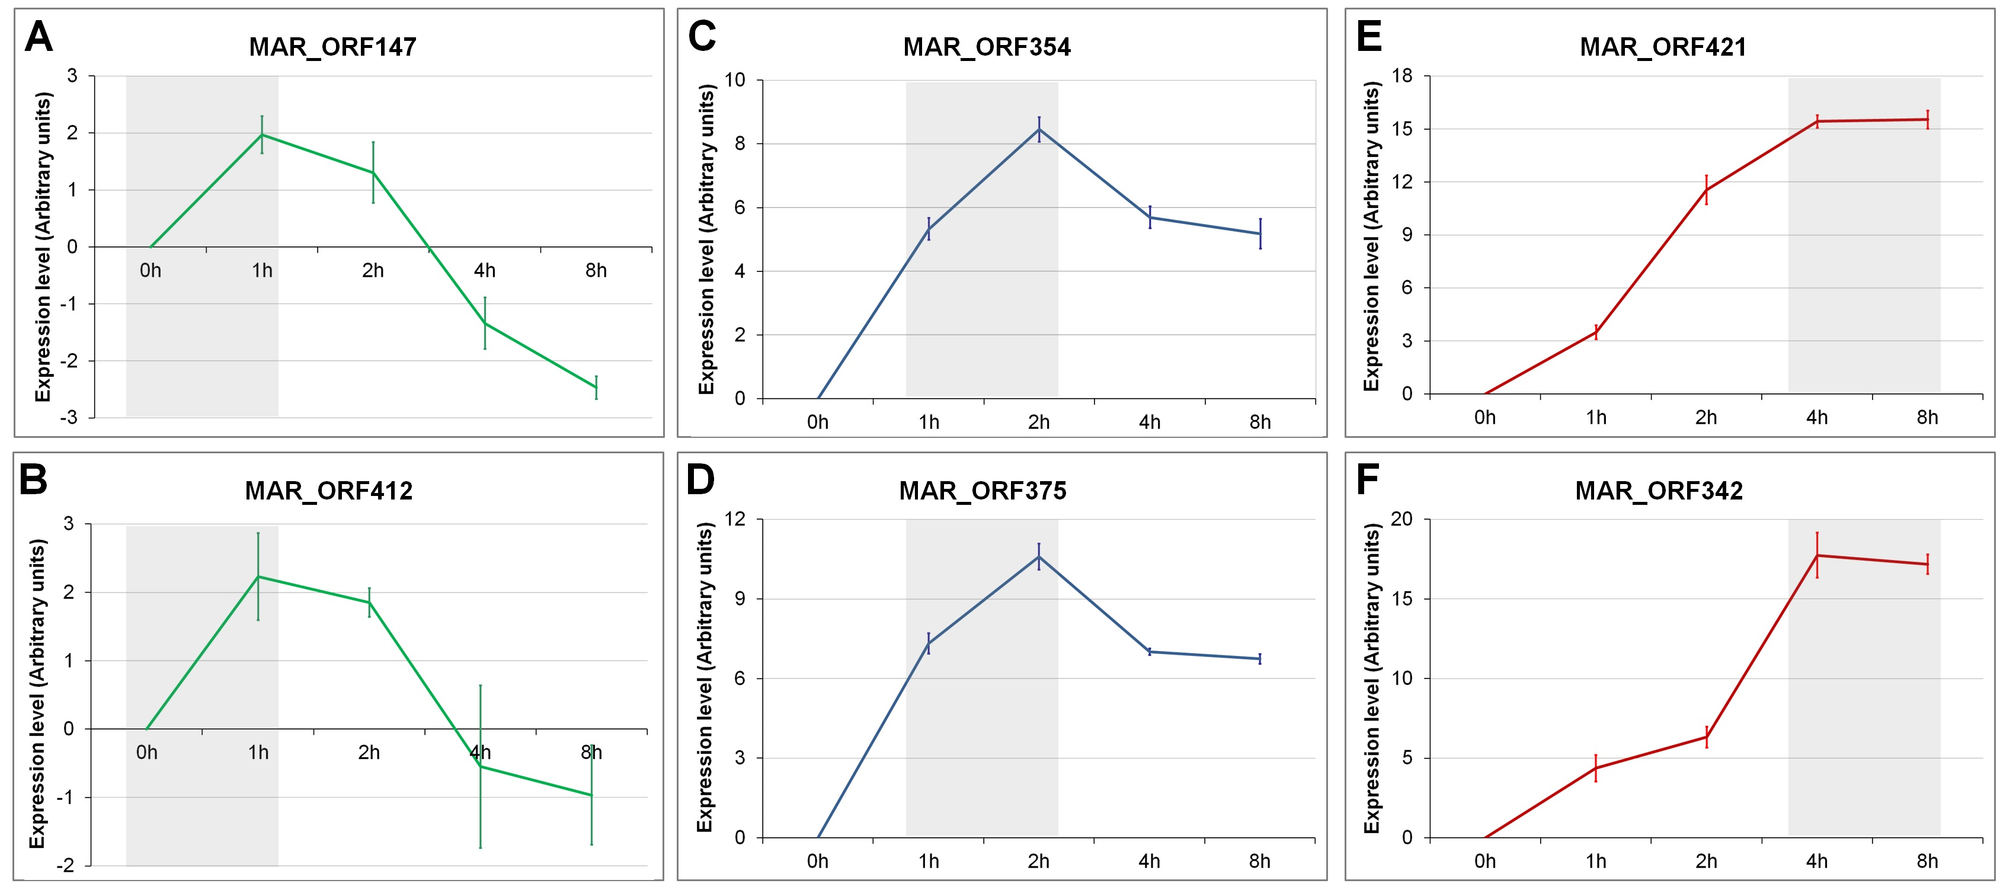
FIG S2: Validation of RNA-seq data by RT-qPCR assays.Molecular assays were performed to validate the temporal profile for gene expression of Marseillevirus using different genes. Gray boxes highlight the peak of activation of the genes, indicating the (A, B) ‘Early’ genes; (C, D) ‘Intermediate’ genes; and (E, F) ‘Late’ genes. The expression levels are depicted as arbitrary units, calculated using the ΔCt method. All assays were performed twice. Error bars indicate standard deviation.
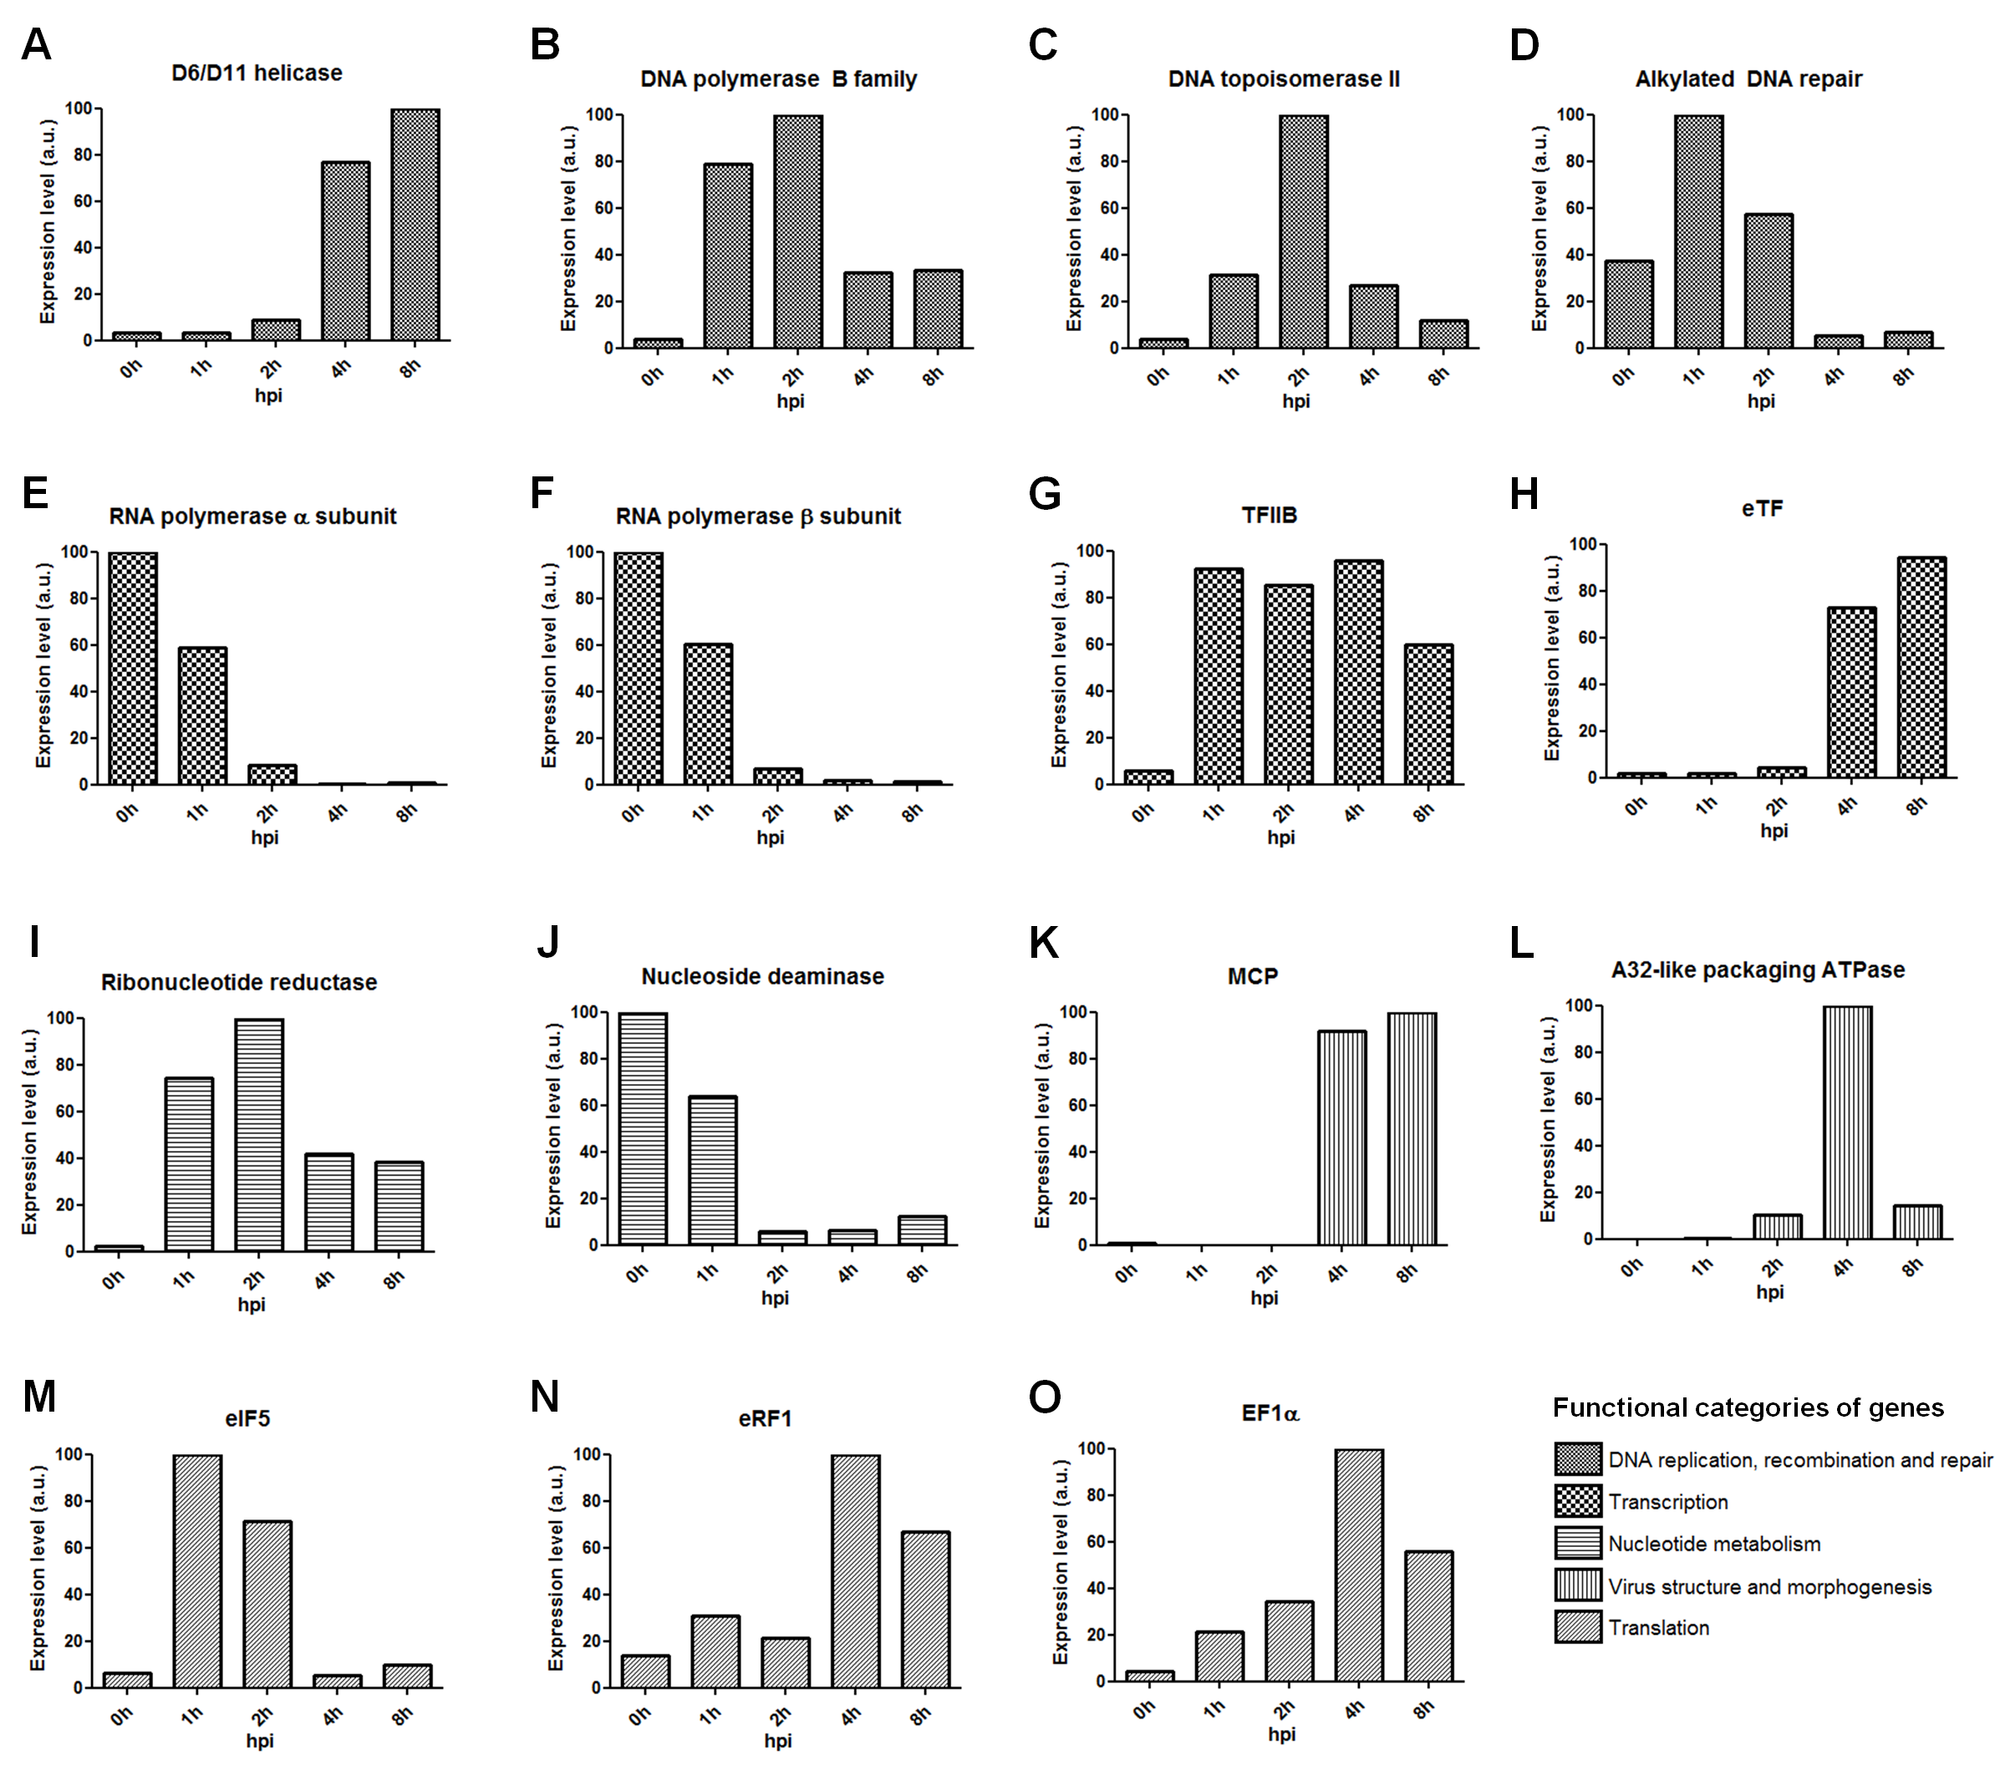 FIG S3: Expression level of different genes based on RNA-seq data. The expression level is based on TPM values of each gene considering different times of infection. The time where the expression level was the highest was considered 100% and the other values were relative to this one. (A) D6/D11 helicase; (B) DNA polymerase B family; (C) DNA topoisomerase II; (D) Alkylated DNA repair protein; (E) RNA polymerase α subunit; (F) RNA polymerase β subunit; (G) Transcription Factor IIB; (H) eukaryotic Transcription Factor; (I) Ribonucleotide reductase small chain; (J) Nucleotide deaminase; (K) Major Capsid Protein; (L) A32-like packaging ATPase; (M) eukaryotic Initiation Factor 5; (N) eukaryotic Release Factor 1; (O) Elongation factor 1α. a.u.: arbitrary units.
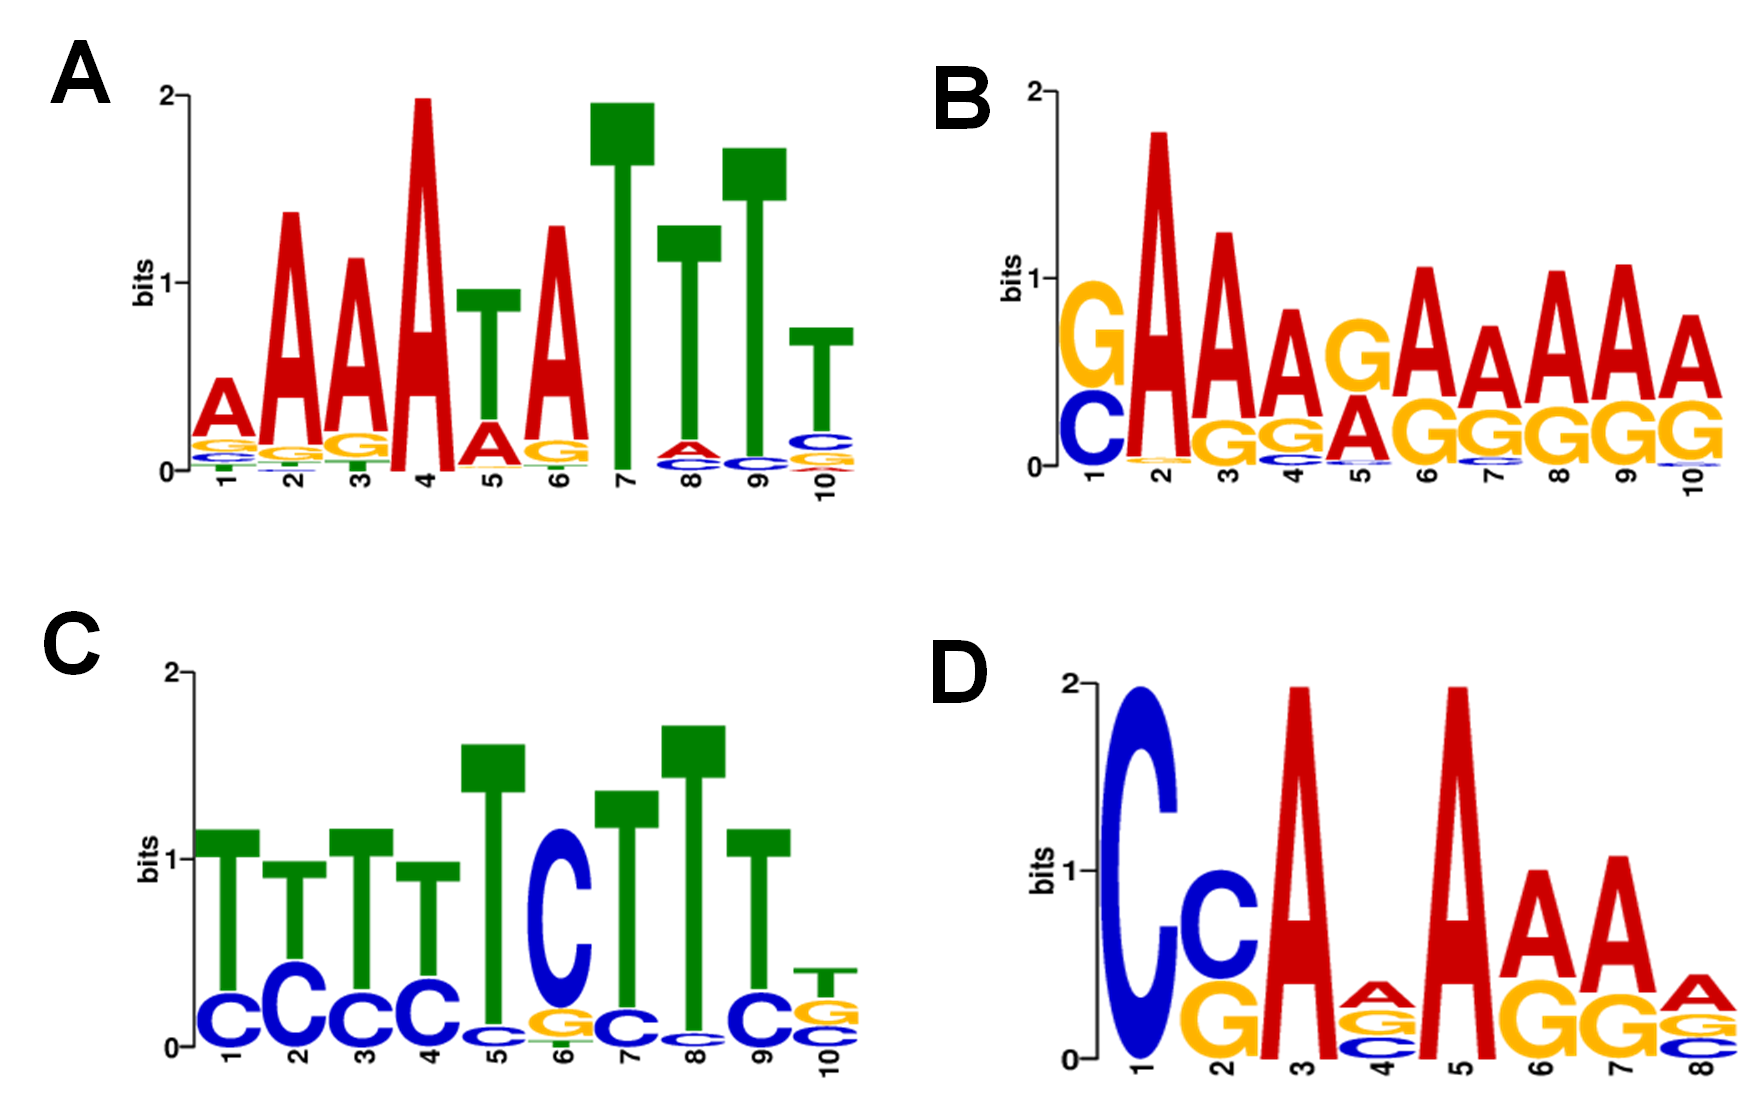
FIG S4: Promoter motifs found in Marseillevirus genome. The motifs are presented from the most representative to the less, considering the e-value cutoff of 1e-5 established during the de novosearch using MEME suit. (A) motif 1; (B) motif 2; (C) motif 3; (D) motif 4.
FIG S5: Expression levels of up and down regulated genes of Acanthamoeba castellanii during the course of infection by Marseillevirus. The function of each gene is depicted in table 2.
Additional file - complement to figure 1: Gene function and temporal class (complement to figure 1). The order of genes presented here by each temporal class is related to the order they are shown in Figure 1.
Additional file - complement to figure 1.xlsx


