Sup. Material: Trapping the enemy: Vermamoeba vermiformis circumvents Faustovirus mariensis dissemination by enclosing viral progeny inside cysts
Supplementary Material:
Trapping the enemy: Vermamoeba vermiformiscircumvents Faustovirus mariensis dissemination by enclosing viral progeny inside cysts
Running title:Vermamoeba vermiformis traps faustovirus inside cysts
Authors:Iara Borges1, Rodrigo Araújo Lima Rodrigues1, Fábio Pio Dornas2, Gabriel Almeida3, Isabella Aquino1,Cláudio Antônio Bonjardim1, Erna Geessien Kroon1, Bernard La Scola4, Jônatas Santos Abrahão1*
Affiliations
1 Laboratório de Vírus, Instituto de Ciências Biológicas, Departamento de Microbiologia, Universidade Federal de Minas Gerais, Belo Horizonte, MG, 31270-901, Brazil.
2 Universidade Federal dos Vales do Jequitinhonha e Mucuri
3 Department of Biological and Environmental Science, University of Jyvaskyla, FI-40014 Jyvaskyla, Finland.
4 URMITE, Aix Marseille Université, UM63, CNRS 7278, IRD 198, INSERM 1095, IHU - Méditerranée Infection, 19-21 boulevard Jean Moulin, 13005 Marseille, France
* Corresponding author: jonatas.abrahao@gmail.com
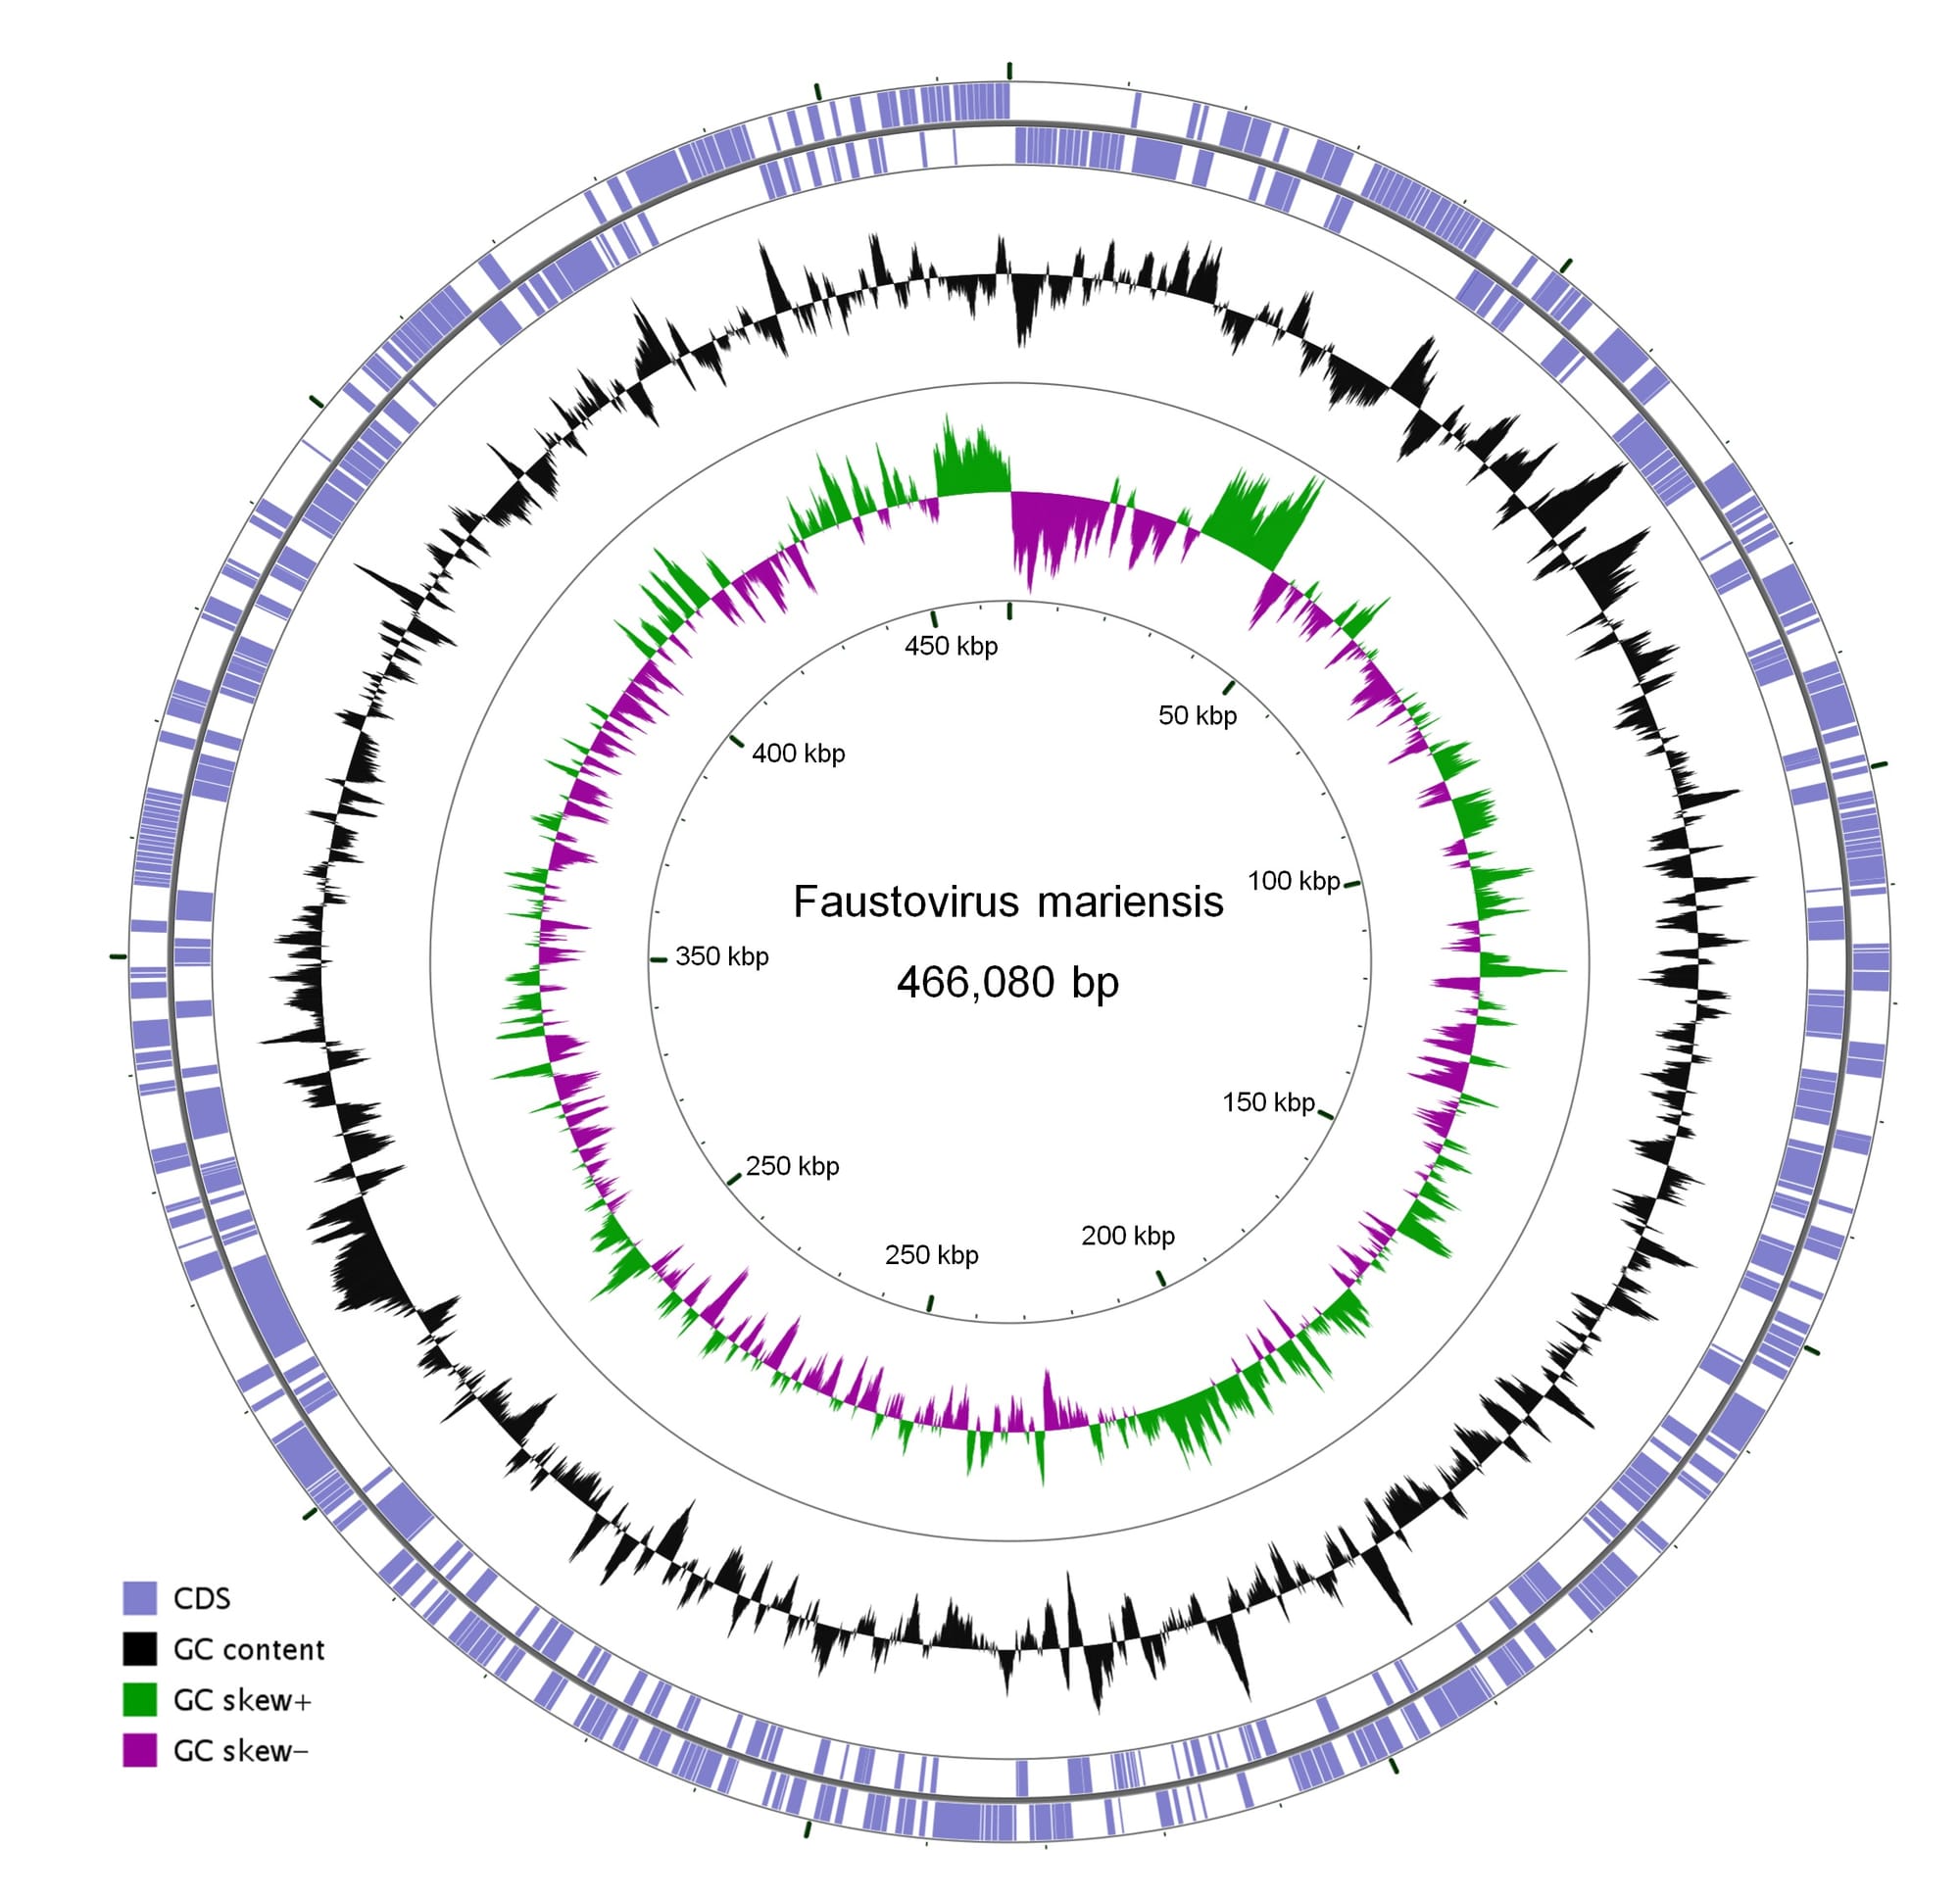
Supplementary Figure 1: Genome of Faustovirus mariensis. Circular representation of the F. mariensis genome. Rings starting from inner to outermost correspond to (i) genome coordinates in kilobases; (ii) GC skew; (iii) GC content; (iv) predicted protein-coding sequences (CDS) in forward and reverse strand. Color legend is provided to the left side of the figure.
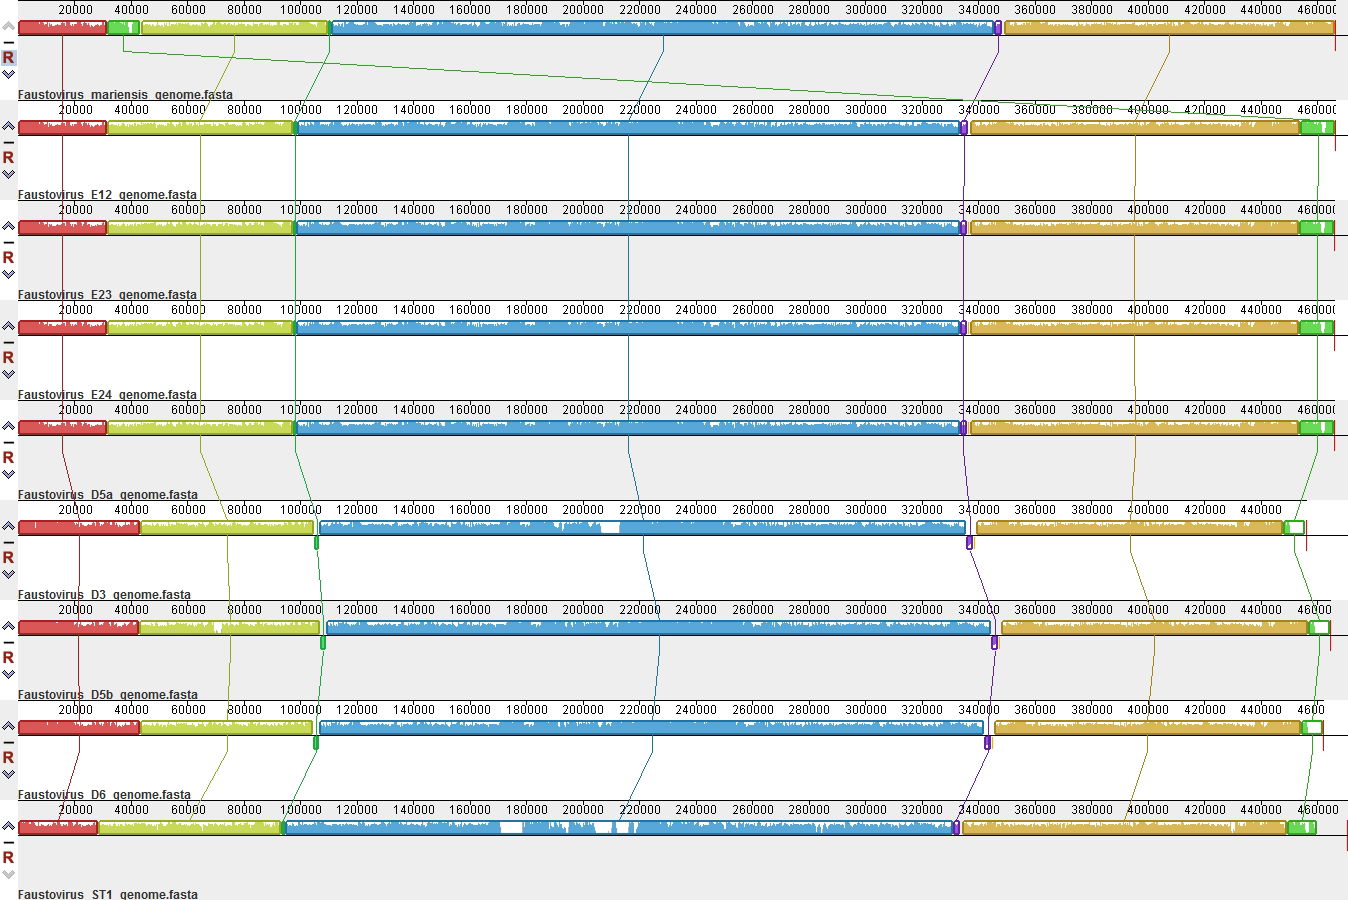
Supplementary Figure 2: Genome synteny analysis of faustoviruses.Schematic genome alignment diagram obtained using the Mauve software package. The analysis was performed using the genome of different faustoviruses isolates, named F. mariensis, E12 (KJ614390.1), E23 (KU702952.1), E24 (KU702948.1), D5a (KU702950.1), D3 (KU556803.1), D5b (KU702949.1), D6 (KU702951.1), and ST1 (LT839607.1). The blocks illustrated above X axis are in the positive strand (forward sense), while blocks below the X-axis are in the negative strand (reverse sense). Lines connect the syntenic blocks throughout the genomes.
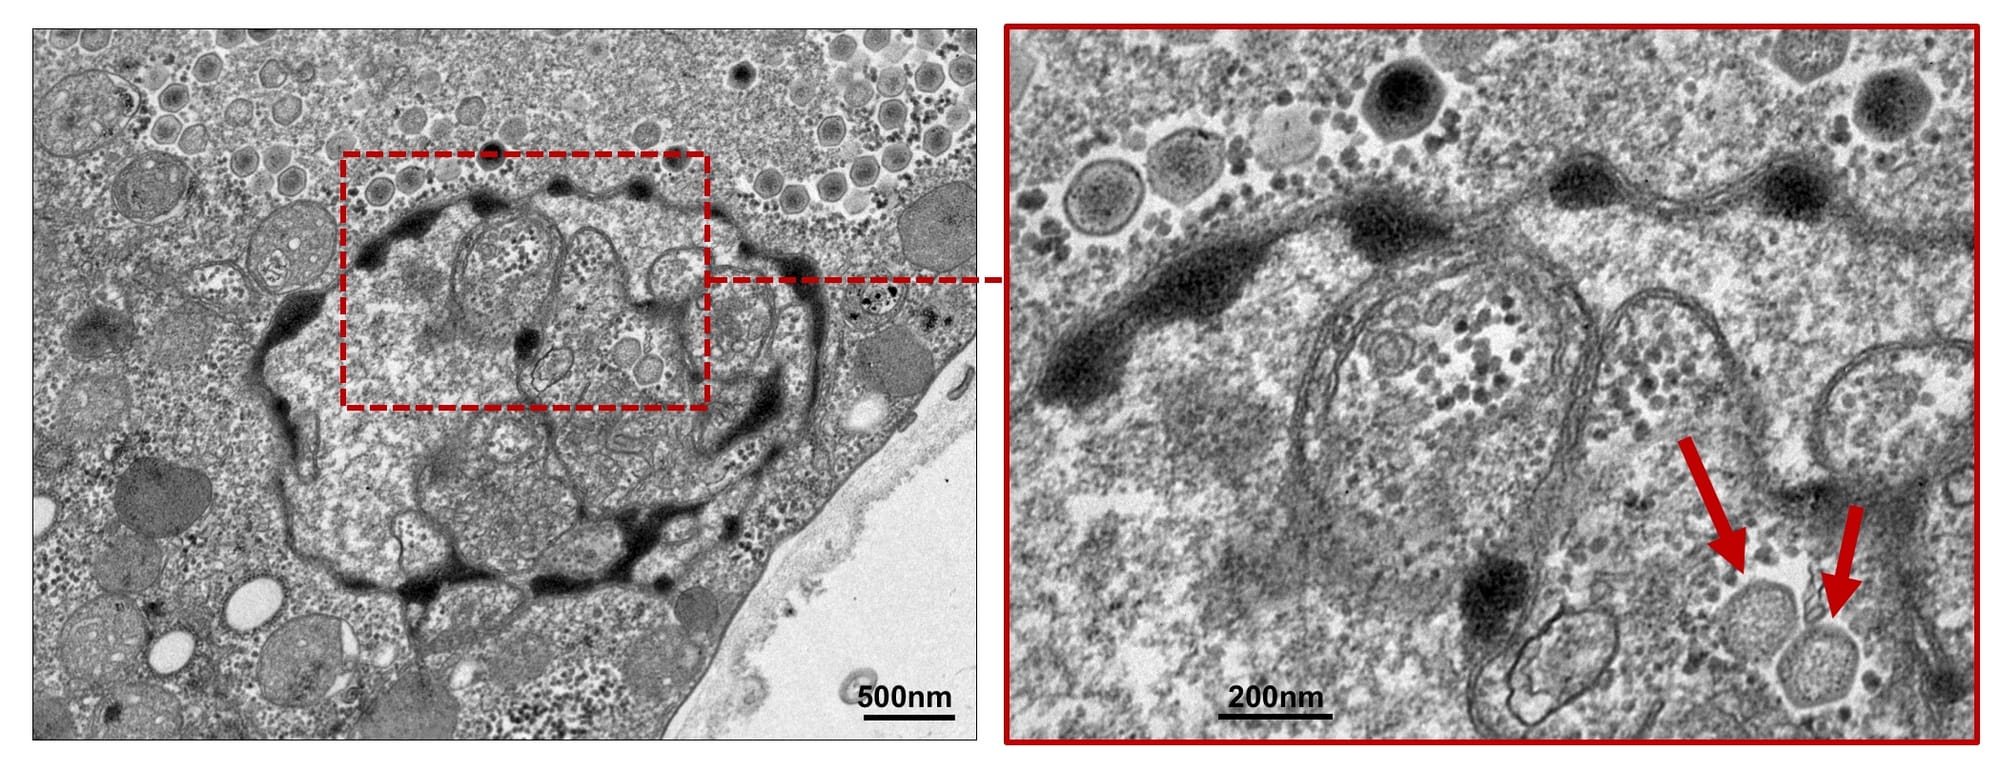
Supplementary Figure 3: Transmission electron microscopy image highlighting the presence of Faustovirus mariensis inside the nucleus of Vermoameba vermiformis.This image was obtained 24 hpi, MOI of 0.1.
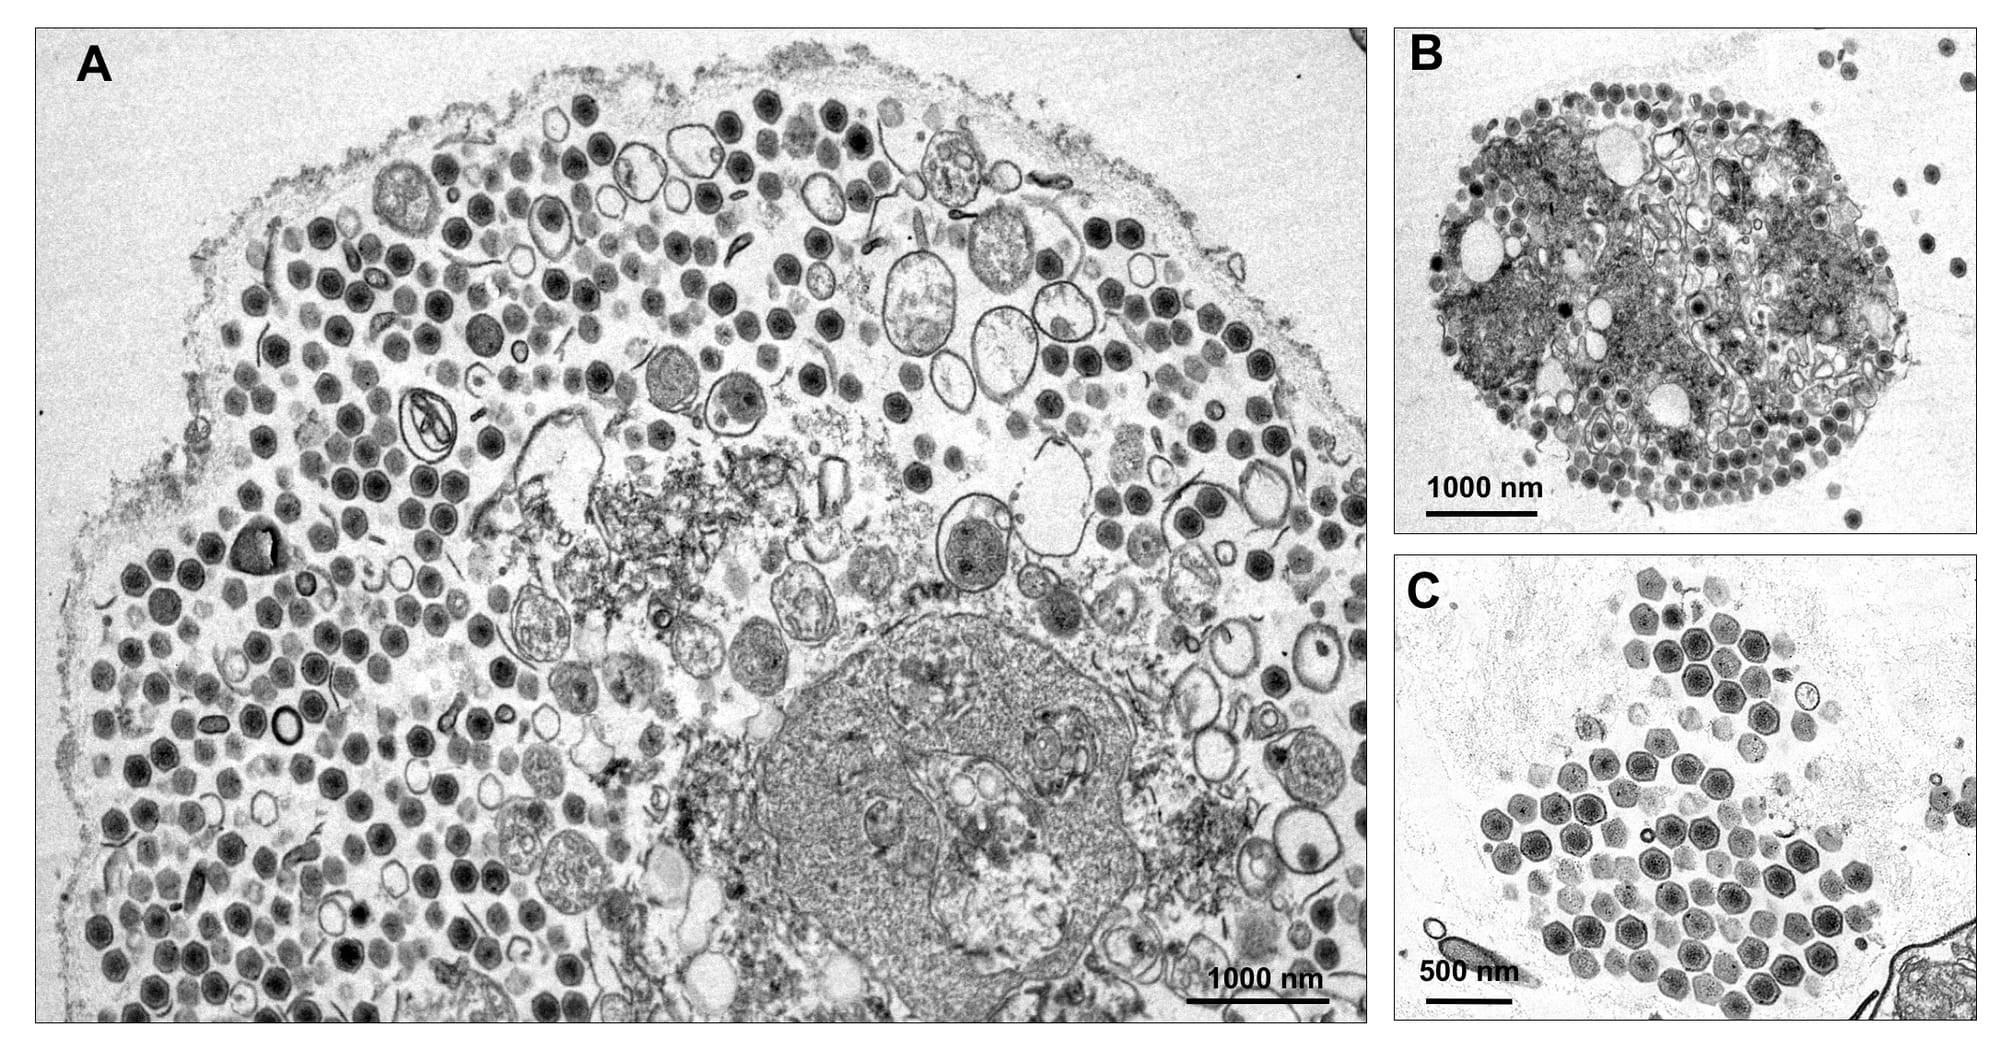
Supplementary Figure 4: Final steps of a lytic cycle of Faustovirus mariensis in Vermamoeba vermiformis.(A) The cytoplasm of V. vermiformis almost fulfilled by Faustovirus particles. (B) A large agglomeration of Faustovirus particles and degraded cellular components released after plasma membrane disruption. (C) F. mariensis particles organized in large honeycombs after lysis. These images were obtained 24 hpi, MOI of 0.1.
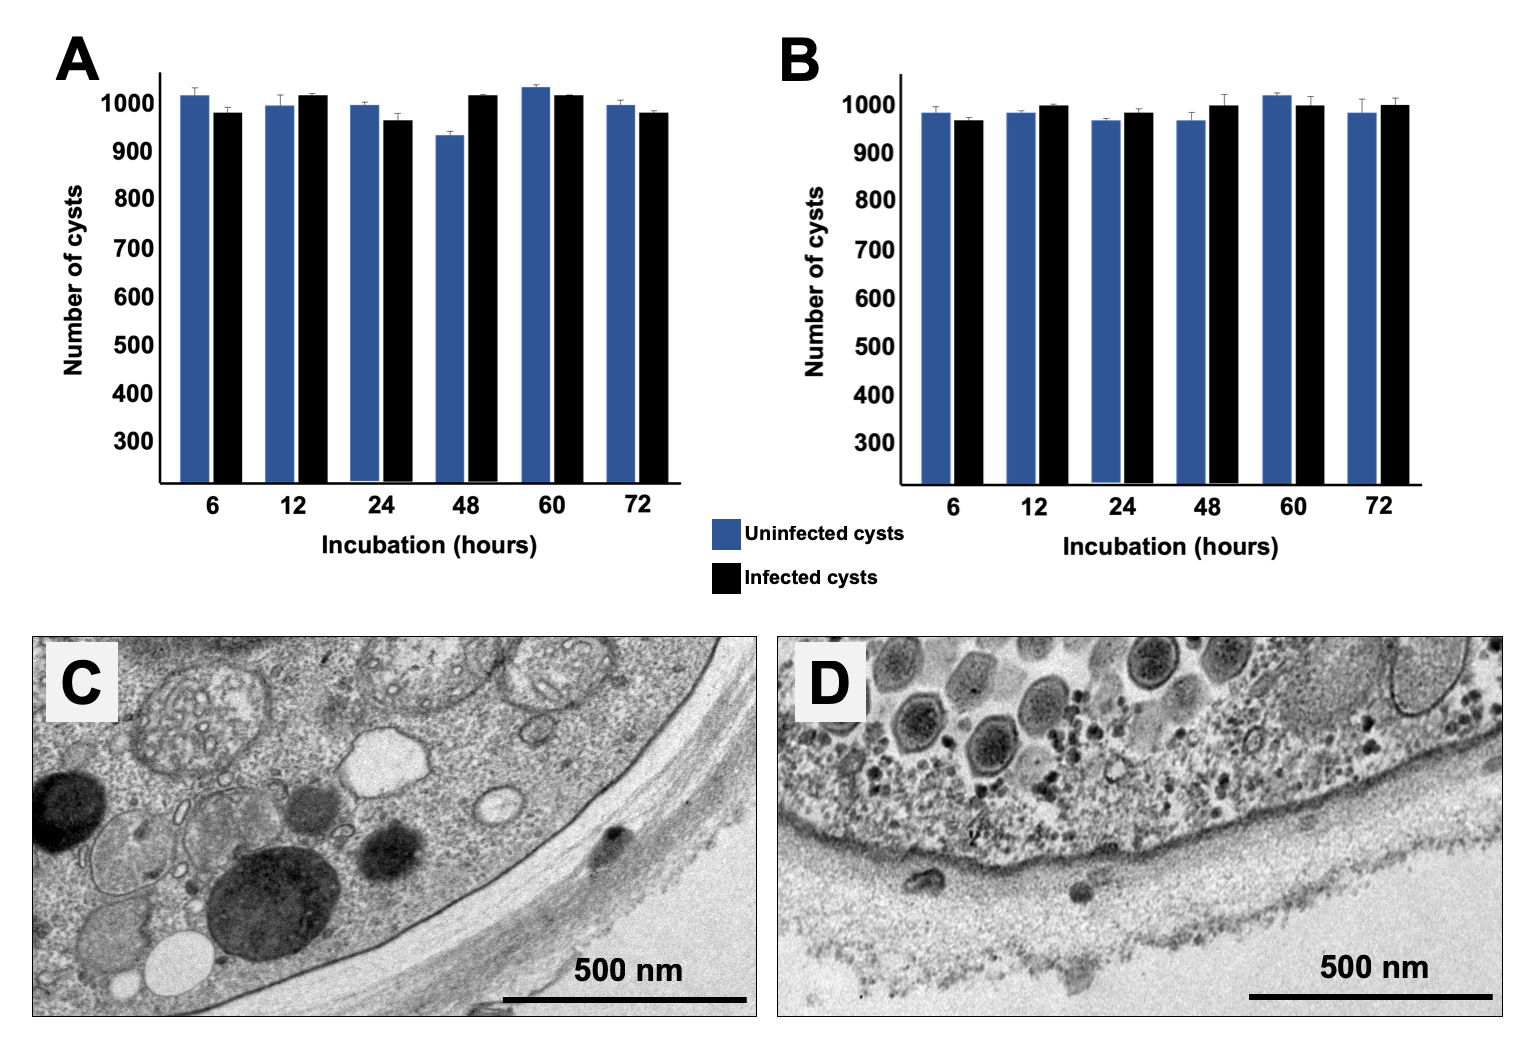
Supplementary Figure 5: Resistance of Vermamoeba vermiformiscysts infected and uninfected by Faustovirus mariensis to hydrochloric acid (A and C) or heating treatments (B and D). A total of 10E6 cysts produced at MOIs of 1 and 10 were submitted to 4% hydrochloric acid or heating (99°C) treatments (more details at paper methods) for 6, 12, 24, 48, 60, and 72 hours, followed by 3 cycles of sonication at 50 kHz (30 seconds each), washed three times with PBS and then quantified in Neubauer chamber. As control, we used cysts produced under non-infectious condition (NEFF solution).


